
ESG benchmarking is defined as the structured process of measuring a company’s environmental, social, and governance performance against peers, frameworks, and science-based standards to identify gaps and set credible targets. The industry also refers to this as comparative ESG performance analysis, and the two terms are used interchangeably across GRI, TCFD, CSRD, SASB, and CDP reporting contexts. Done well, ESG benchmarking best practices give sustainability professionals and investors a defensible, repeatable method for improving disclosure quality and driving real performance gains. Done poorly, they produce misleading comparisons that expose companies to SEC comment risk and investor skepticism.
1. What are the core design choices for effective ESG benchmarking?
Benchmark design starts with three foundational decisions: what to benchmark, who to benchmark against, and which data sources to trust. Grant Thornton positions these as the key choices that determine whether a benchmark delivers board-level credibility or just a long spreadsheet. Getting them right before collecting a single data point saves weeks of rework.
Focus: theme-specific vs. full-report benchmarking. Theme-specific benchmarks concentrate on one material topic, such as Scope 1 and 2 emissions or board diversity. Full-report benchmarks cover the entire disclosure. Theme-specific work produces deeper, more actionable findings. Full-report benchmarks are better suited for annual gap analysis ahead of regulatory filings.

Peer group scope. A well-designed benchmark constrains peer group size early to avoid a volume of data that dilutes insights. Larger peer groups with many criteria lose the analytical depth that makes benchmarking useful at the board level. Aim for a peer group that is large enough to be statistically meaningful but small enough to allow detailed comparison.
Data source credibility. Credible benchmarks draw from primary filings, CDP responses, and verified third-party databases rather than aggregated rating scores. Aggregated scores introduce provider-specific weighting assumptions that can distort comparisons across sectors.
Pro Tip: Start every benchmarking project by writing a one-page scope document that names the focus topic, peer group size limit, and primary data source. This single step prevents scope creep and keeps the output relevant to decision-makers.
2. How to select peers and metrics for meaningful comparisons
Peer selection is the most consequential methodological choice in any ESG benchmarking program. Finrep’s disclosure benchmarking approach recommends filtering candidates on SIC code, revenue range, filing recency within 18 months, and similar regulatory exposure. That combination produces a peer set of 8–12 companies that share enough structural similarity to make comparisons valid.
Once you have your peer set, metric selection determines whether comparisons are fair. Council Fire recommends using both absolute and intensity metrics together. Absolute metrics, such as total Scope 1 emissions in metric tons, show the real-world impact scale. Intensity metrics, such as emissions per million dollars of revenue, normalize for company size and enable apples-to-apples comparison across peers of different scales.
Normalization is also a source of methodological risk. Revenue-based intensity metrics can misrepresent performance when peers have significantly different pricing power. Production-based metrics require comparable product definitions across the peer set. Rigorous documentation of normalization choices and an audit trail are best practice, not optional extras.
The following filters produce a defensible peer set:
- Match on primary SIC code or GICS sector classification.
- Filter by revenue range within a 0.5x to 2x band of your company’s size.
- Include only filings published within the past 18 months.
- Confirm similar regulatory exposure, such as SEC filer status or CSRD applicability.
- Limit the final set to 8–12 companies to preserve analytical depth.
- Prioritize peers that report under the same frameworks you use, such as GRI or SASB.
- Exclude peers with material data gaps above 30% for your target KPIs.
Pro Tip: When intensity metrics produce outlier results for one peer, check whether that company recently changed its revenue recognition method. A one-time accounting change can make a peer look far cleaner or dirtier than it actually is.
3. What are best practices for ESG disclosure benchmarking against regulatory expectations?
Disclosure benchmarking against regulatory expectations requires a structured workflow, not just a side-by-side comparison of annual reports. Proactive benchmarking against peers before filings improves disclosure quality, reduces SEC comment risk, and documents defensible practices. The workflow starts with building a coverage grid.
A coverage grid maps every material disclosure topic across your peer set. For each topic, the grid records whether the disclosure exists, where it appears in the filing, how specific the language is, and what the peer median looks like. Practitioners build these grids at the EDGAR section level, comparing specificity and identifying gaps that need remediation before the next filing cycle.
CDP scoring adds another layer of complexity. CDP uses a four-level scoring system with essential criteria gates that cap scores if key data is missing. From 2024 onward, essential criteria require benchmarking specific data points, not just overall disclosure percentages. A company can score well on volume of disclosure and still be capped at a lower tier because one essential data point is absent.
The table below shows how a coverage grid structures disclosure benchmarking across key regulatory frameworks:
| Disclosure topic | Framework | Peer median coverage | Your coverage | Gap priority |
|---|---|---|---|---|
| Scope 1 and 2 emissions | TCFD / CSRD | High | High | None |
| Scope 3 value chain | GRI 305 | Medium | Low | High |
| Climate scenario analysis | TCFD | Medium | None | High |
| Board ESG oversight | ESRS E1 | High | Medium | Medium |
| Water withdrawal intensity | SASB | Low | None | Low |
Integrating ESRS, TCFD, and CSRD requirements into a single coverage grid prevents teams from treating each framework as a separate project. The overlaps are substantial, and a unified grid surfaces them clearly.
4. How to use benchmarking insights for target-setting and action planning
Benchmarking results are only useful when they feed directly into target-setting and capital allocation decisions. The gap analysis from your coverage grid and metric comparisons tells you where you lag peers. The next step is translating that gap into a specific, time-bound target with a credible methodology behind it.
SBTi guidance forms the core expectation for valid near-term science-based targets. SBTi requires absolute Scope 1 and Scope 2 reductions aligned to a 1.5°C pathway. Scope 3 targets are often handled through intensity-based methods when absolute reductions are harder to model. Aligning your targets to SBTi after benchmarking gives them external credibility that internal targets alone cannot achieve.
The action planning process works best when it follows this sequence:
- Identify the top three gaps from your peer comparison, ranked by materiality and regulatory exposure.
- Set absolute targets for Scope 1 and 2 emissions using SBTi’s required reduction rates.
- Set intensity targets for Scope 3 categories where absolute baselines are unreliable.
- Assign capital allocation to each target, connecting sustainability goals to the annual budget cycle.
- Schedule quarterly reviews to track progress and update benchmarks as new peer data becomes available.
“Benchmarking is not ranking. It provides context for performance and informs strategic decisions when peer groups and normalization are well-chosen.” — Council Fire
Continuous benchmarking, rather than annual cycles, is the direction the field is moving. Quarterly refreshes allow companies to catch emerging peer disclosures and adjust targets before they become compliance liabilities.
5. How do ESG rating divergences affect benchmarking tool choices?
Rating divergence is a real and documented problem in ESG data. Different providers score the same company differently because they use different methodologies, weightings, and data sources. This variance makes it unreliable to benchmark using aggregated provider scores as your primary input.
Sustainability Atlas recommends defining 8–12 sector-specific KPIs with at least 85% data coverage across your peer set, weighting raw data over aggregated ratings, and running frequent refresh cycles. This approach reduces provider score variance and improves benchmarking accuracy for investors. The 85% coverage threshold is a practical floor. Below it, gaps in the data start to introduce more noise than signal.
Choosing a benchmarking platform also matters. Platforms that surface raw underlying data alongside aggregated scores give sustainability teams the ability to audit comparisons and defend methodology choices to regulators and investors. Platforms that only show composite scores hide the assumptions that drive them. For industry-specific KPI tracking, sector-aligned tools produce more relevant peer comparisons than generic ESG databases.
Key takeaways
Effective ESG benchmarking requires defined scope, a peer set of 8–12 comparable companies, both absolute and intensity metrics, and a structured coverage grid to identify and remediate disclosure gaps before filing.
| Point | Details |
|---|---|
| Define scope first | Fix the benchmark focus and peer group size before collecting any data. |
| Use both metric types | Combine absolute and intensity metrics to show impact scale and enable fair comparison. |
| Build a coverage grid | Map disclosure topics across peers to identify gaps and prioritize remediation. |
| Align targets to SBTi | Use science-based methods to set credible absolute Scope 1 and 2 reduction targets. |
| Weight raw data over scores | Use underlying KPI data rather than aggregated ratings to reduce provider variance. |
The uncomfortable truth about ESG benchmarking
Most ESG benchmarking programs fail not because of bad data but because of bad scope decisions made in the first week. Teams try to benchmark everything against everyone, and the result is a report that impresses no one and informs nothing. I have seen sustainability teams spend three months building a peer comparison that covered 40 companies and 80 metrics. The output was so dense that the board asked for a one-pager. The one-pager contained the only three findings that actually mattered.
The practitioners who get this right do one thing differently. They treat peer group selection as a strategic choice, not an administrative task. They defend their normalization methods in writing before anyone asks. They build coverage grids that connect directly to the next filing cycle, not to a theoretical best-practice document. And they run quarterly updates rather than waiting for the annual report season to discover they have fallen behind peers.
The trend toward continuous benchmarking and real-time data is real, and it favors teams that have already built clean, documented workflows. If your current process relies on manual spreadsheets and annual consultant engagements, you are already a cycle behind. The companies that will lead on ESG disclosure in the next three years are the ones building repeatable, auditable benchmarking programs right now.
— ESG Team
Esgautomated makes ESG benchmarking repeatable and audit-ready
Sustainability professionals and investors who want to apply these practices at scale need a platform that handles data collection, metric calculation, and peer comparison without manual spreadsheet work.
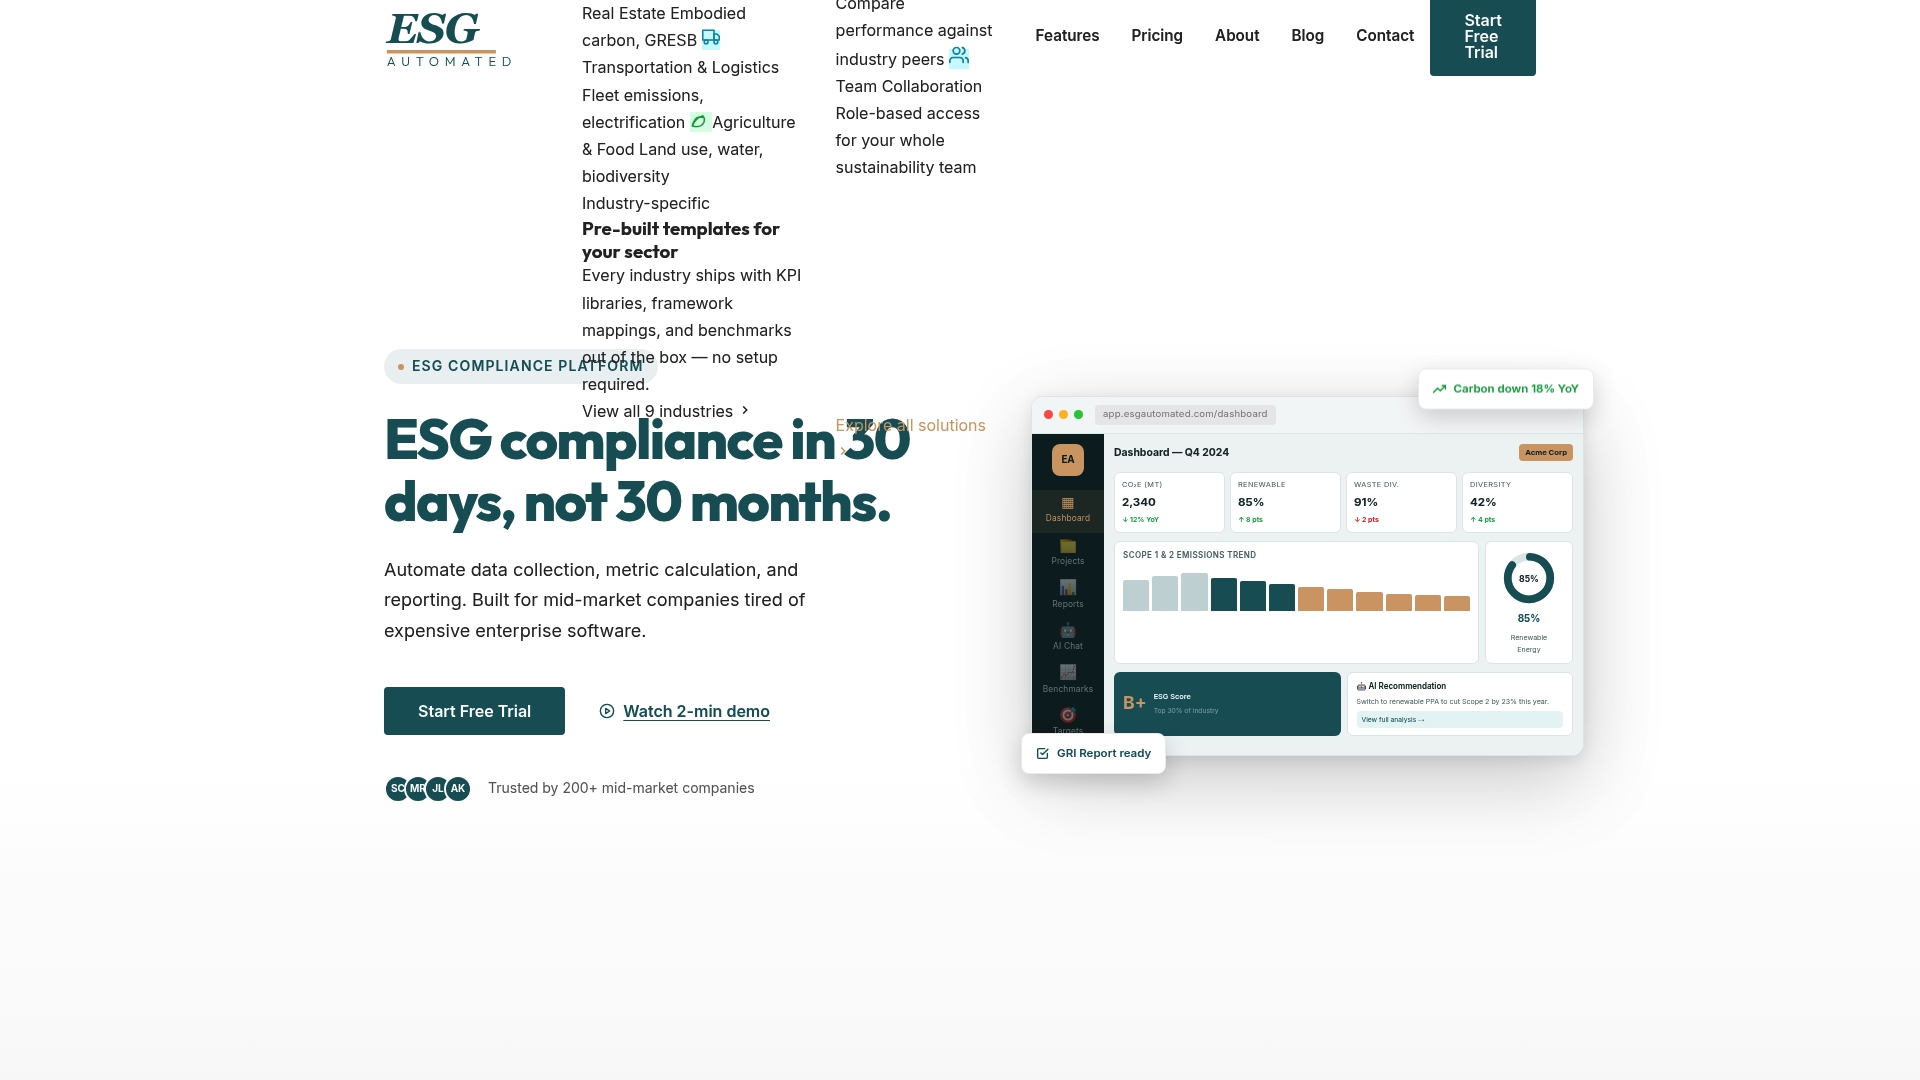
Esgautomated automates data collection and metric calculation across GRI, TCFD, CSRD, SASB, and CDP frameworks. The platform supports industry-specific KPI tracking for sectors including energy, technology, and construction, making peer group comparisons more relevant and defensible. Companies using Esgautomated get their first audit-ready ESG report in 30 days. The platform replaces expensive consultant engagements and manual processes with a structured, repeatable workflow built for mid-market companies that need to meet SEC, CDP, and ESRS expectations without enterprise software budgets.
FAQ
What is ESG benchmarking and why does it matter?
ESG benchmarking is the process of comparing a company’s environmental, social, and governance performance against peers and frameworks to identify gaps and set targets. It matters because it gives sustainability professionals and investors a defensible basis for disclosure decisions and capital allocation.
How many peers should be in an ESG benchmark peer set?
A peer set of 8–12 companies, filtered by SIC code, revenue range, filing recency, and regulatory exposure, produces comparisons that are both statistically meaningful and analytically deep enough to act on.
What is the difference between absolute and intensity ESG metrics?
Absolute metrics show total impact, such as total Scope 1 emissions in metric tons. Intensity metrics normalize for company size, such as emissions per million dollars of revenue, enabling fair comparison across peers of different scales.
How does CDP scoring affect ESG benchmarking?
CDP uses a four-level scoring system with essential criteria gates that cap scores when key data points are missing. Benchmarking must target specific required data points, not just overall disclosure volume, to avoid being capped at a lower tier.
How often should ESG benchmarks be refreshed?
Quarterly refresh cycles are best practice. Annual cycles leave teams exposed to emerging peer disclosures and regulatory changes that can make a filing look outdated before it is even submitted.