
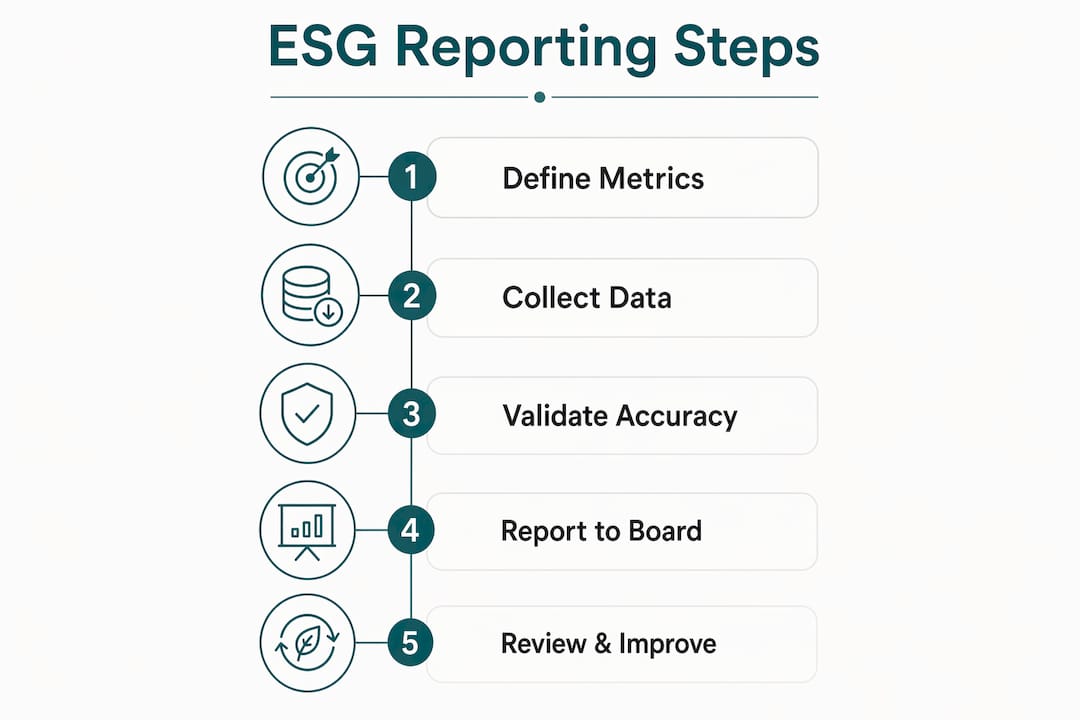
The ESG metrics board reporting process is the system by which organizations gather, validate, and present environmental, social, and governance data to their boards for informed oversight and strategic decision-making. Boards that execute this process well gain audit-grade traceability across GRI, TCFD, CSRD, SASB, and CDP frameworks. Companies that integrate ESG reporting stand to realize up to 60% operating profit increase by Q4 2026. That figure signals ESG is no longer a compliance checkbox. It is a direct input to financial performance. Yet only 39% of companies currently produce formal, auditable sustainability reports. Boards that act now hold a clear competitive advantage.
What does the ESG metrics board reporting process require?
Effective ESG board reporting starts with governance structure, not software. Before any data flows to the boardroom, organizations need clearly defined roles, a materiality assessment, and a framework selection. Skipping these steps produces reports that look complete but cannot survive an audit.
Governance roles and the RACI matrix
Audit committees are increasingly responsible for ESG reporting oversight because of their expertise with financial controls and assurance. That alignment makes sense. ESG data carries the same legal weight as financial disclosures. A clear RACI matrix assigns data integrity and assurance to the audit committee, while strategy sits with a separate ESG or risk committee. The CFO, ESG officer, and departmental data managers each hold defined accountability. Without that clarity, metric ownership gaps create conflicting data versions at the worst possible moment.

The ESG leadership model is also shifting toward a CFO-style operating structure. Routine data collection and calculation get outsourced or automated. Strategic oversight stays internal. Boards that understand this distinction allocate resources more effectively and avoid paying consultant rates for work that technology handles.
Tool categories for ESG data management
Not all reporting tools serve the same function. The table below maps feature categories to their board-level purpose.
| Feature category | Board-level purpose |
|---|---|
| Automated data collection | Reduces manual entry errors and speeds up cycle time |
| Multi-framework mapping | Aligns metrics to GRI, TCFD, CSRD, SASB, and CDP simultaneously |
| Audit trail logging | Provides traceable evidence for third-party assurance |
| Role-based approval workflows | Documents sign-off chains required for audit-grade reporting |
| Dashboard and KRI visualization | Presents ESG performance indicators alongside financial metrics |
Entry-level spreadsheet approaches cover none of these categories reliably. Mid-market platforms built for ESG automation cover all five. The gap between those two options is where most audit failures originate.
How to execute ESG data collection, validation, and reporting
Audit-grade ESG reporting demands controls throughout the full data lifecycle, from metric definition through final board presentation. Most organizations apply controls only at the reporting stage. That approach produces conflicting metric versions and audit friction that derails board confidence.
Step-by-step process for board-ready ESG data
-
Define metrics with documented calculation methods. Each ESG performance indicator needs a written definition, a calculation formula, and a named data source. Ambiguity at this stage multiplies downstream errors.
-
Assign data owners across departments. Operations, HR, finance, and facilities each own specific metric inputs. Assign a named individual, not a team, to each data stream. Accountability without a name attached is not accountability.
-
Collect data on a quarterly cadence. Annual data collection is the single most common cause of year-end scrambles. Quarterly pulls catch errors early and reduce the volume of corrections at reporting time. Establishing a carbon footprint baseline alone requires 6–10 weeks from project kickoff to final report. Build that timeline into your annual calendar.
-
Validate through multi-level quality controls. Cross-reference reported figures against source systems. Flag statistical outliers automatically. Require a second reviewer sign-off on any metric that deviates more than 10% from the prior period.
-
Approve via formal documented workflows. Every metric that reaches the board should carry a documented approval chain. The CFO or ESG officer signs off before data enters the board package.
-
Prepare board-ready reports integrated with risk dashboards. ESG performance measurement does not belong in a standalone PDF. It belongs inside the same dashboard where the board reviews financial and operational KPIs.
Pro Tip: Build your validation checklist before your first data collection cycle, not after. Retrofitting controls onto existing data is three times more labor-intensive than designing them upfront.
Validation best practices that prevent the most common failures:
- Reconcile ESG data against financial records where overlap exists (energy spend vs. emissions, headcount vs. social metrics)
- Maintain a version-controlled metric register so the board always sees one authoritative number
- Document every data adjustment with a reason code and approver name
- Run a pre-board dry-run review with the CFO and audit committee chair at least five business days before the board meeting
What challenges arise in ESG metrics board reporting?
The most damaging ESG reporting failures share a common root cause. Controls get applied only at the end of the process, not throughout it. Multiple conflicting metric versions emerge when data passes through several departments without consistent validation checkpoints. By the time the board sees the numbers, tracing the discrepancy back to its source takes weeks.
Legal exposure compounds the operational risk. Under-reporting ESG data risks regulatory penalties. Over-reporting risks litigation. Both outcomes are avoidable with third-party assurance and documented governance. The board cannot rely on management’s word alone when the legal stakes are this high.
Common challenges boards face in ESG performance measurement:
- Siloed data ownership with no cross-functional reconciliation process
- RACI overlaps where both the audit committee and ESG committee claim ownership of the same metric
- Year-end data collection that compresses a 12-month process into six weeks
- Absence of a single source of truth, leading to multiple spreadsheet versions circulating before board meetings
- Inadequate audit trails that fail third-party assurance reviews
Pro Tip: Assign one executive sponsor to own the ESG board reporting calendar. When no single person is accountable for the timeline, deadlines slip and board packages arrive incomplete.
Boards that treat ESG reporting as a year-round strategic cycle rather than a year-end event reduce audit friction significantly. That shift also improves the quality of board engagement. Directors who see ESG data quarterly ask better questions and make more informed decisions than those who see it once a year in a dense annual report.
The role of ESG in corporate governance is expanding precisely because boards now recognize that sustainability data carries the same strategic weight as earnings data.
How to integrate ESG metrics into enterprise risk dashboards
Boards must integrate ESG Key Risk Indicators into enterprise risk dashboards alongside financial metrics for audit-grade traceability. That integration is the difference between ESG reporting as a compliance exercise and ESG reporting as a governance tool. When ESG KRIs sit inside the same dashboard as revenue variance and operational risk flags, directors treat them with the same analytical rigor.
Mapping disclosure obligations across frameworks
Start by listing every disclosure obligation your organization carries. CSRD applies to large EU-market companies. TCFD applies to climate-related financial disclosures. SASB provides industry-specific metrics. GRI covers broad stakeholder reporting. CDP focuses on environmental data. Most mid-market companies operating across borders carry obligations under at least three of these frameworks simultaneously. Map each metric to its framework requirement before building the dashboard. That mapping prevents duplication and identifies gaps before an auditor does.
Dashboard design and metric threshold setting
Set thresholds for each ESG KRI that reflect your board’s risk appetite. A carbon intensity metric above a defined threshold should trigger the same escalation process as a financial covenant breach. Boards that apply this discipline to ESG performance indicators stop treating sustainability data as soft information. The table below shows how ESG metric categories connect to board-level oversight functions.
| ESG metric category | Example indicators | Board oversight function |
|---|---|---|
| Environmental | Scope 1, 2, and 3 emissions; energy intensity | Risk committee, audit committee |
| Social | Employee turnover rate; safety incident frequency | Compensation committee, full board |
| Governance | Board diversity ratio; audit finding resolution rate | Audit committee, nominating committee |
| Climate financial risk | Physical and transition risk exposure | CFO, risk committee |
| Supply chain | Supplier ESG audit pass rate | Operations committee, audit committee |
The CFO’s role in this integration is underappreciated. Finance input is critical to ESG reporting success because financial controls provide the methodology that ESG data governance lacks in most organizations. CFOs who apply the same rigor to ESG data that they apply to revenue recognition produce board packages that hold up under external scrutiny.
Pro Tip: Run your ESG KRI dashboard through a tabletop audit exercise once per year. Simulate an external auditor’s questions and identify where your evidence chain breaks down before it breaks down in a real review.
Key Takeaways
The ESG metrics board reporting process succeeds when audit-grade controls, clear governance roles, and integrated risk dashboards work together from metric definition through board presentation.
| Point | Details |
|---|---|
| Governance structure comes first | Define RACI roles for audit committee, CFO, and ESG officer before selecting tools or frameworks. |
| Controls belong throughout the data lifecycle | Apply validation and approval checkpoints at collection, not only at final reporting. |
| ESG KRIs belong in risk dashboards | Integrate sustainability indicators alongside financial metrics for board-level analytical rigor. |
| Year-round cadence reduces audit friction | Quarterly data collection prevents year-end scrambles and improves board engagement quality. |
| Legal risk runs in both directions | Under-reporting and over-reporting both carry legal consequences; third-party assurance is the safeguard. |
The shift boards cannot afford to miss
The boards I have worked with that struggle most with ESG reporting share one pattern. They treat it as a communications exercise rather than a data governance discipline. They assign it to the sustainability team, keep it separate from finance, and present it to the board once a year in a polished report that nobody can trace back to a source system. That approach worked when ESG was voluntary. It does not work under CSRD, TCFD, or any framework that requires third-party assurance.
The shift that actually changes outcomes is moving ESG performance measurement into the same governance infrastructure that manages financial reporting. That means the CFO owns the data controls. The audit committee reviews the methodology. The board sees ESG KRIs quarterly alongside earnings. When that structure is in place, the annual sustainability report becomes a summary of decisions already made, not a document assembled under pressure.
The ESG benchmarking practices that produce the most defensible board reports are not the most complex ones. They are the ones with the clearest ownership, the most consistent cadence, and the shortest distance between raw data and board presentation. Automation closes that distance faster than any consultant can.
The boards that invest in this infrastructure now will not just meet 2026 compliance deadlines. They will have a governance asset that compounds in value as regulatory requirements tighten and investor scrutiny increases.
— ESG Team
How Esgautomated supports your ESG board reporting
Esgautomated is an AI-powered ESG compliance platform built for mid-market companies that need audit-ready ESG reporting without the cost of enterprise software or external consultants. The platform automates data collection, metric calculation, and multi-framework mapping across GRI, TCFD, CSRD, SASB, and CDP. Companies get their first audit-ready ESG report in 30 days.
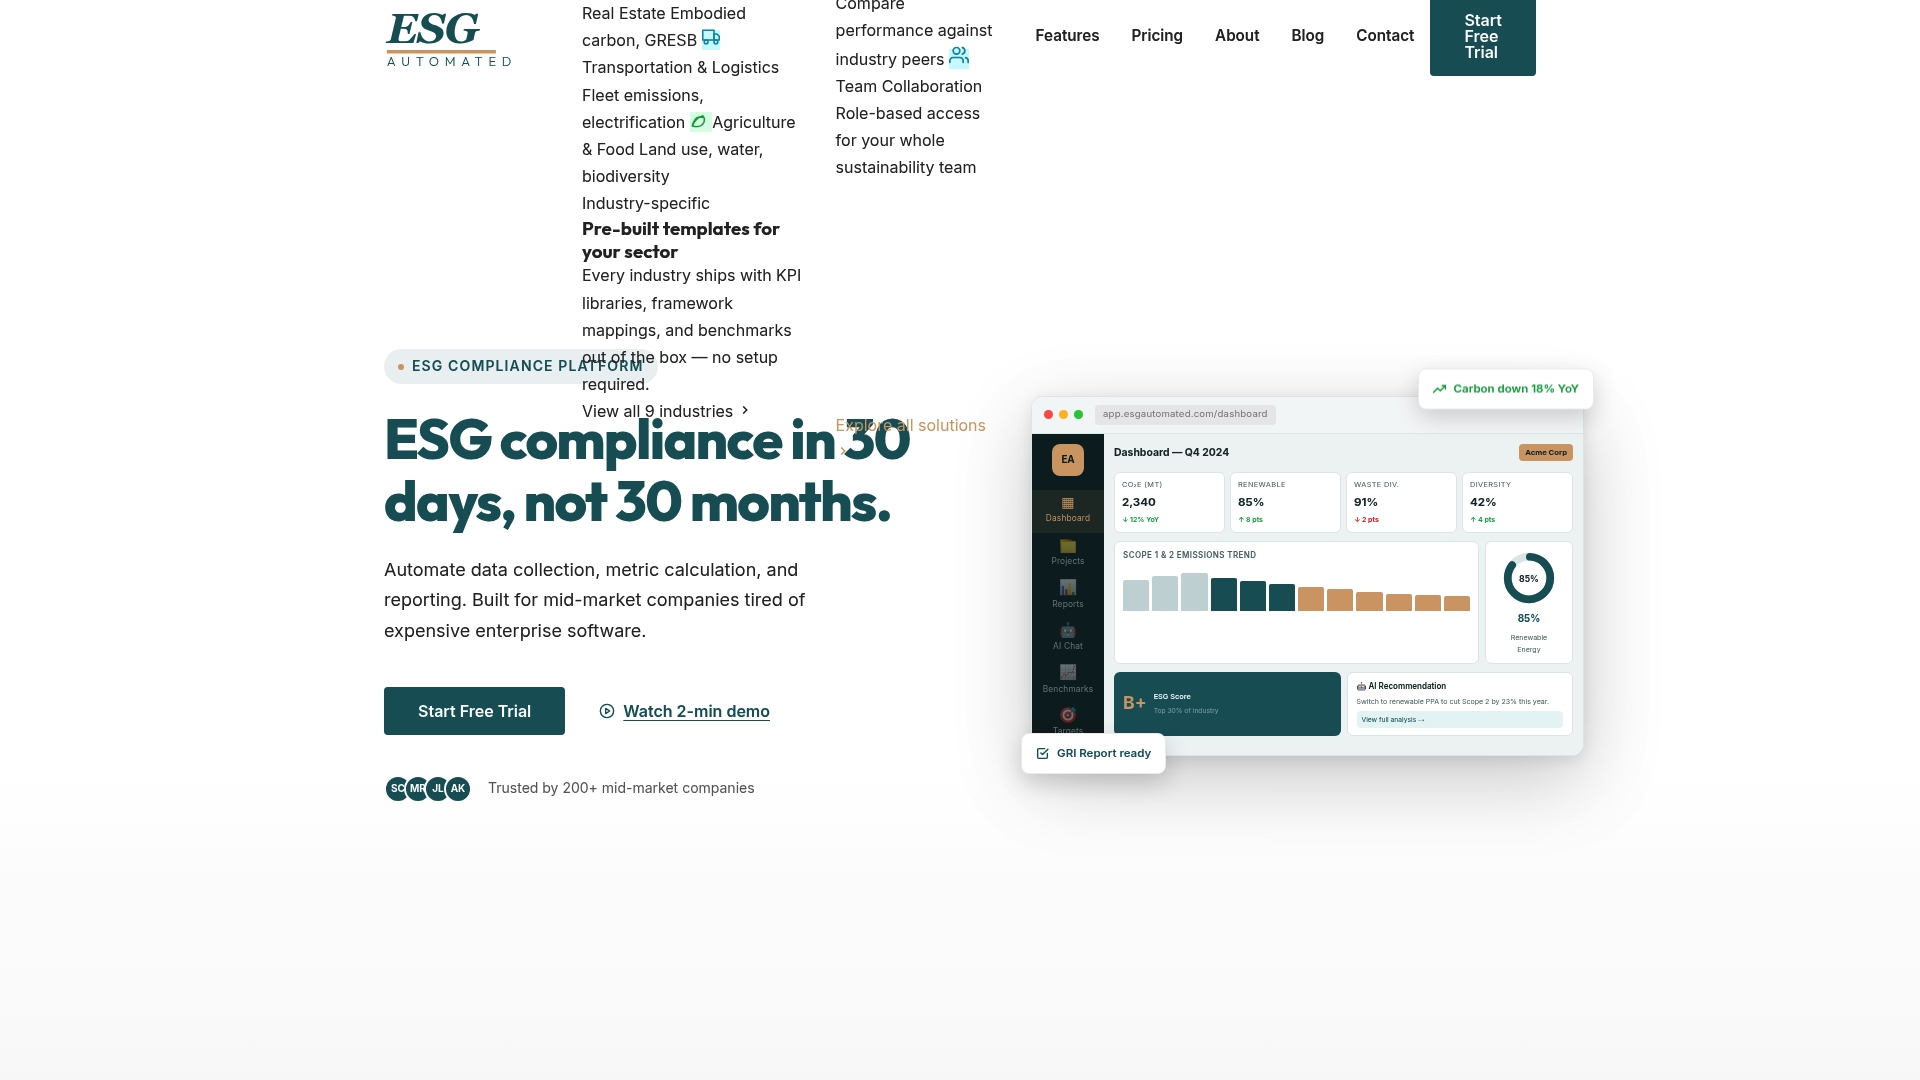
Finance leaders can also use Esgautomated to plan and manage their ESG compliance budget with clear cost visibility before committing resources. The platform serves companies across financial services, technology, retail, energy, and construction. Visit esgautomated.com to request a demo and see how your board reporting process can reach audit-grade readiness within a single quarter.
FAQ
What is the ESG metrics board reporting process?
The ESG metrics board reporting process is the structured system by which organizations define, collect, validate, and present environmental, social, and governance data to their boards for oversight and strategic decision-making. It requires audit-grade controls at every stage of the data lifecycle, not only at final reporting.
Which frameworks apply to ESG board reporting in 2026?
The most widely applicable frameworks are GRI, TCFD, CSRD, SASB, and CDP. Most mid-market companies with cross-border operations carry disclosure obligations under at least three of these simultaneously.
Who owns ESG data governance at the board level?
Audit committees are increasingly responsible for ESG reporting oversight because of their expertise with financial controls and assurance. The CFO, ESG officer, and departmental data managers each hold defined roles within a formal RACI structure.
How often should boards review ESG performance indicators?
Boards should review ESG performance indicators quarterly, not annually. Quarterly cadence reduces year-end audit friction and produces more informed board engagement with sustainability data.
What is the biggest risk in ESG board reporting?
The legal risk runs in both directions: under-reporting ESG data invites regulatory penalties, while over-reporting risks litigation. Third-party assurance and documented governance controls are the primary safeguards against both outcomes.