
ESG integration in financial reporting is defined as the practice of embedding sustainability metrics directly within financial disclosures, using recognized frameworks like IFRS S1/S2, EU CSRD, and ESRS to satisfy regulatory requirements and investor expectations. The best examples of ESG integration in financial reporting show that this is not a separate communication exercise. It is a finance discipline with its own data pipelines, controls, and audit trails. For CFOs and ESG officers operating under tightening disclosure mandates in 2026, understanding how leading companies have done this is the fastest path to compliance.
1. Examples of ESG integration in financial reporting: fully integrated annual reports
The clearest examples come from companies that have stopped publishing standalone sustainability reports and moved ESG disclosures into their core annual filings. A.P. Moller-Maersk and Schneider Electric both demonstrate this model, embedding sustainability data within their annual reports under CSRD and ESRS standards. Their reports include digital tagging of ESG data points, limited assurance from external auditors, and narrative sections that connect sustainability performance directly to financial outcomes.
“The shift from a standalone sustainability report to a fully integrated annual report is not cosmetic. It changes the legal status of the data, the assurance requirements, and the liability exposure for the board.”
Natura &Co takes a similar approach under the International Integrated Reporting Framework, presenting sustainability as a driver of long-term value creation rather than a compliance checkbox. Their integrated report maps environmental and social performance to capital allocation decisions, making the link between ESG factors and financial returns explicit for investors.
The practical benefit of this format is that stakeholders, including analysts, regulators, and lenders, read one document instead of two. That reduces the risk of contradictory claims appearing across separate filings, which is a growing source of greenwashing liability.

2. How IFRS S1 and S2 connect ESG risks to financial statements
IFRS S1 and S2 require sustainability-related financial disclosures to appear alongside general-purpose financial reports. That means ESG risks must be expressed in terms of their impact on cash flow, access to finance, and cost of capital, not just in qualitative narrative.
The table below shows how IFRS S1/S2 requirements map to traditional financial statement elements.
| ESG Risk Category | Financial Statement Impact | IFRS S1/S2 Disclosure Requirement |
|---|---|---|
| Physical climate risk | Asset impairment, insurance costs | Quantified exposure in notes |
| Transition risk | Capital expenditure, stranded assets | Scenario analysis disclosure |
| Social/governance risk | Litigation provisions, staff costs | Narrative plus financial estimates |
| Supply chain ESG risk | Cost of goods, procurement costs | Dependency and concentration risk |
CFOs choosing between ISSB (financial materiality) and EU CSRD (double materiality) face a scope decision that shapes the entire reporting architecture. ISSB focuses on how ESG risks affect the company financially, while CSRD requires companies to also report how their operations affect the environment and society. Getting this choice right at the start prevents costly rework later.
3. Building an audit-ready ESG reporting pipeline
An audit-ready ESG reporting pipeline typically requires a 4–5 month preparation period before external assurance is possible. That window covers gap analysis, KPI definition, data source mapping, and control implementation. Companies that skip this phase and go straight to assurance consistently fail their first review.
The preparation sequence follows a logical order:
- Gap analysis. Map current ESG data collection against the target framework (CSRD, ISSB, GRI) to identify missing metrics and weak data sources.
- KPI definition. Agree on precise metric definitions, including boundaries, units, and estimation methods, before any data collection begins.
- Source registry. Build a source registry linking every metric to its primary data source, owner, collection method, and known estimations.
- Control implementation. Apply RACI matrices and segregation of duties to ESG data flows, mirroring the controls already used in financial reporting.
- Evidence retention. Set retention policies aligned to financial audit cycles. Evidence retention aligned to a 5–7 year cycle is the standard that external assurers expect.
- Audit trail documentation. Create process narratives that link each reported metric back to its source data, showing the calculation path an auditor would follow.
Pro Tip: Assign a named data owner to every ESG metric before the pipeline is built. Metrics without owners are the single most common cause of assurance failures.
4. Applying financial controls to ESG data flows
Assurance-ready ESG controls do not require new machinery. They require applying familiar financial control concepts, specifically RACI frameworks and segregation of duties, to ESG data collection and validation. Finance teams already understand these tools. The challenge is extending them to sustainability data, which often lives in operational systems outside the finance function.
Segregation of duties means the person who collects energy consumption data should not be the same person who validates it for the report. This mirrors the control logic used in accounts payable and is immediately recognizable to external auditors. Linking ESG reporting processes to existing financial control structures creates a common language across functions, which speeds up assurance reviews significantly.
The investor reporting workflow also benefits from this integration. When ESG data flows through the same control environment as financial data, investor-facing disclosures carry the same credibility as audited accounts.
5. Structuring ESG data at the disclosure level
ESG disclosures structured at the data-point level can be mapped to multiple frameworks, including CSRD and ISSB, without duplication or rework. This is the architecture decision that separates companies managing one reporting cycle efficiently from those rebuilding their data every time a new framework requirement arrives.
The practical implication is that each metric should carry metadata: the framework it satisfies, the boundary it covers, the estimation method used, and the assurance status. A Scope 1 emissions figure, for example, should be tagged to GRI 305, CSRD ESRS E1, and IFRS S2 simultaneously. That single data point then populates multiple disclosure sections without manual re-entry.
Pro Tip: Build your ESG data architecture for the most demanding framework you expect to face in the next three years. Retrofitting a CSRD-grade system onto a GRI-only foundation costs more than building it right the first time.
6. Practical challenges in integrating ESG metrics into financial reporting
The most common failure mode is treating ESG as a separate communication exercise rather than a financial discipline. Marketing ESG claims that are not traceable to the same validated data pipelines supporting regulatory filings creates greenwashing liability. Regulators in the EU and the SEC in the US have both signaled that unverified ESG claims in investor communications will face enforcement action.
ESG risks propagate through financial impacts across three dimensions: operational, reputational, and supply chain. A physical climate event, for example, can simultaneously impair assets, disrupt supplier relationships, and trigger reputational damage that affects revenue. Reporting that captures only one of these dimensions understates the financial exposure.
The most overlooked risk is weak data quality controls around ESG metrics. Errors or misstatements in ESG data undermine the credibility of the entire integrated report, not just the sustainability section. Cross-functional collaboration between finance, operations, and sustainability teams is the structural fix, not a software purchase.
Key pitfalls to address before your next reporting cycle:
- Siloed data ownership. ESG data collected by operations teams without finance oversight lacks the controls auditors expect.
- Inconsistent metric definitions. Using different boundaries for the same metric across reporting periods makes year-on-year comparison unreliable.
- Missing documentation. Process narratives explaining how metrics are calculated are as important as the metrics themselves.
- Unlinked ESG claims. Sustainability statements in investor presentations must trace back to the same data supporting the formal disclosure.
7. Using ESG benchmarking to strengthen financial disclosures
ESG benchmarking best practices give CFOs a reference point for assessing whether their disclosed metrics are credible relative to sector peers. Benchmarking serves two functions in financial reporting: it validates that your methodology is consistent with industry norms, and it identifies gaps where your disclosure is thinner than what investors expect from comparable companies.
For financial services firms, benchmarking against sector-specific SASB standards provides the clearest signal of disclosure quality. For energy companies, TCFD scenario analysis benchmarks show whether your climate risk quantification is in line with peer practice. The financial services ESG context adds another layer: lenders and asset managers face their own SFDR and TCFD obligations, which means their ESG disclosures must also reflect the ESG performance of their portfolios.
Key Takeaways
Effective ESG integration in financial reporting requires structured data pipelines, framework-aligned controls, and audit-ready documentation built before the reporting cycle begins.
| Point | Details |
|---|---|
| Integrated reports outperform standalone filings | Embedding ESG in annual reports reduces contradictory claims and strengthens legal standing. |
| IFRS S1/S2 require financial linkage | ESG risks must connect to cash flow, cost of capital, and asset values in formal disclosures. |
| Audit readiness takes 4–5 months | Gap analysis, KPI definition, and control implementation must precede external assurance. |
| Data-point architecture enables multi-framework use | Structuring metrics with full metadata allows one data set to satisfy CSRD, ISSB, and GRI. |
| Data quality controls are the highest-risk gap | Weak controls around ESG data quality expose firms to misstatement risk across the full report. |
What I’ve learned about ESG integration that most guides won’t tell you
The companies that get ESG integration right are not the ones with the biggest sustainability teams. They are the ones where the CFO treats ESG data with the same skepticism applied to revenue figures. I have seen well-resourced sustainability functions produce beautifully designed reports that fail assurance on the first pass because no one in finance ever questioned the underlying data.
The regulatory shift driven by CSRD and IFRS S1/S2 is actually good news for finance professionals. It forces ESG reporting into the same accountability structure that finance already owns. That means CFOs now have both the authority and the obligation to demand the same evidence standards from ESG data that they demand from financial data.
The hardest cultural change is getting sustainability teams to accept that “directionally correct” is not good enough for a financial disclosure. A carbon figure that is approximately right is a liability. A carbon figure with a documented methodology, a named data owner, and a clear audit trail is an asset.
— ESG Team
Esgautomated supports audit-ready ESG financial disclosures
Mid-market companies face the same CSRD and IFRS S1/S2 requirements as large enterprises, but without the internal resources to build a compliant reporting architecture from scratch.
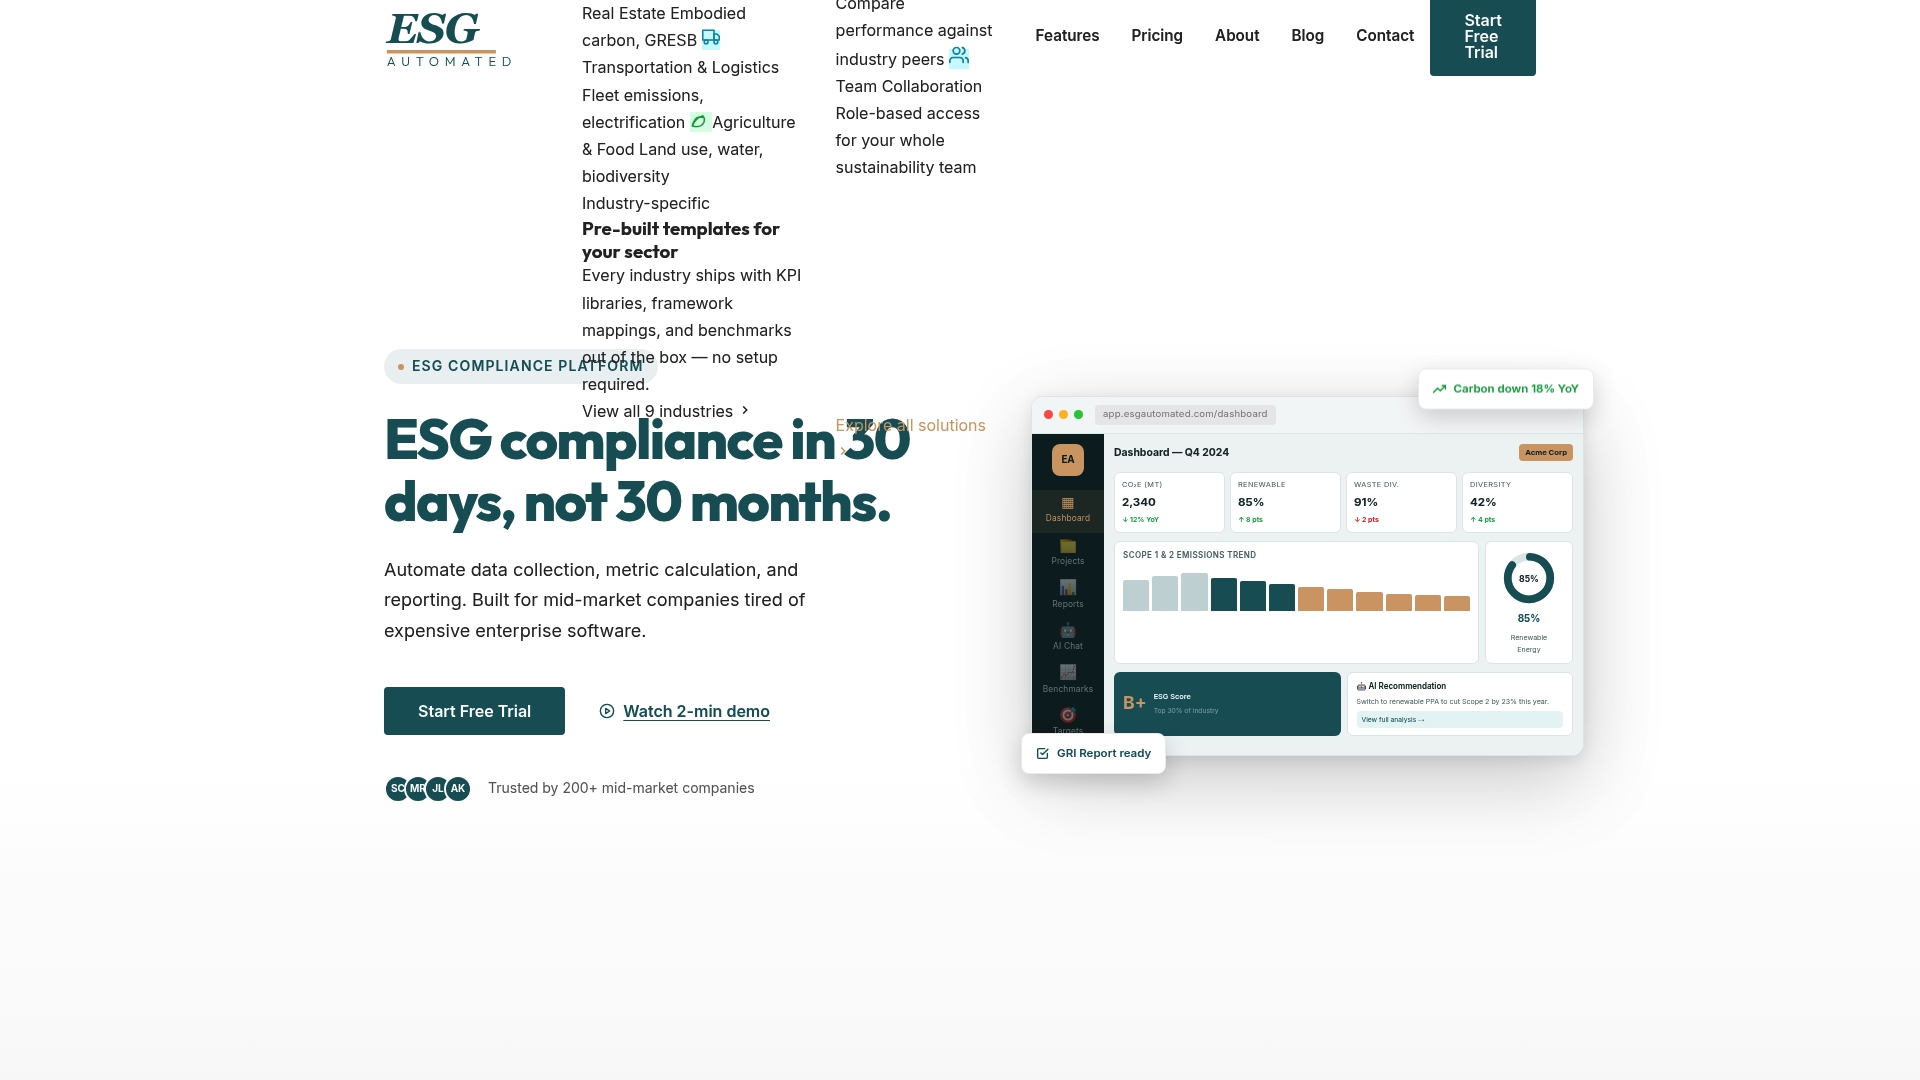
Esgautomated automates data collection, metric calculation, and multi-framework reporting across GRI, TCFD, CSRD, SASB, and CDP. The platform applies financial-grade controls to ESG data flows, generates audit trails at the metric level, and produces your first audit-ready ESG report in 30 days. For teams managing financial services ESG obligations, Esgautomated replaces manual spreadsheets and expensive consultants with a single, assurance-ready system built for the pace regulators now demand.
FAQ
What are the main examples of ESG integration in financial reporting?
Leading examples include A.P. Moller-Maersk, Schneider Electric, and Natura &Co, which embed sustainability disclosures directly within annual reports under CSRD, ESRS, and the International Integrated Reporting Framework.
What do IFRS S1 and S2 require from financial reports?
IFRS S1 and S2 require companies to disclose sustainability-related financial information alongside general-purpose financial reports, linking ESG risks to cash flow, cost of capital, and asset values.
How long does it take to build an audit-ready ESG reporting pipeline?
Building an audit-ready pipeline typically requires a 4–5 month preparation period covering gap analysis, KPI definition, source registry creation, and control implementation before external assurance is possible.
What is the difference between ISSB and CSRD for financial reporting?
ISSB applies financial materiality, focusing on ESG risks that affect the company’s finances, while CSRD applies double materiality, also requiring disclosure of how the company’s operations affect the environment and society.
What is the biggest risk in ESG financial disclosure?
The biggest risk is weak data quality controls around ESG metrics. Errors or misstatements in ESG data undermine the credibility of the entire integrated report and expose the company to regulatory scrutiny.